
April 2010

Here I summarise three studies from the last few months that appear to tell us important things about trends in the climate system

Three recent studies
Thirty years ago, the study of Earth’s climate system was a rather small scientific enterprise - probably most of the practicing scientists knew each other and could read all the published research. Things are very different now. New findings, of major importance, are announced all the time, so it’s quite hard for anyone following the subject to keep a good idea of what is known, and how the certainty of knowledge is changing.
That’s why I thought I’d try to summarize three papers from the last few months which seemed to be unusually significant. One of them tells us, apparently with much better precision, what the atmospheric carbon dioxide was doing over the last 20 million years. Another one reveals that some of the very big submarine methane deposits in the Arctic Ocean are not as stable as we had thought; and a third tells us what the GRACE satellites reveal about accelerated melting of the Greenland and West Antarctic ice sheets. A fourth paper, James Hansen’s review of the issue of climate sensitivity, published a year ago is also a very important bit of work, but deserves an entry of its own.
On the whole, new findings about the responses of the climate system to rapid greenhouse gas forcing tend to reveal new system dynamics that we’d either never suspected, or underestimated. In other words, the trend of new discoveries is mostly bad news. No doubt this is due to our very incomplete understanding of the properties of the system that cause abrupt changes. These were only disclosed in the last 30 years or so when detailed records of past climate were recovered from ice sheet and sea-bed cores - but since then there’s been no doubt that our provocation would bring unpredictable consequences, and that they could be sudden and severe. That’s exactly what the record tells us - as clear as can be. The only trouble is, no forcing as large or fast as ours has ever happened before (at least the record shows none - not for the whole 65 million years of the Cenozoic, for which the sea-floor record is pretty good).
What that means is that the only way we can get any idea what might happen to the Earth in our grandkids’ time is to carefully put together everything we know about climate responses to past events with everything we know about what is happening now. When this is done, the overwhelming impression is of a climate system in an unbalanced state, steadily moving toward some cascade of rapid changes.
It’s been pointed out correctly that although humans have lived through major climate changes before (the glacial transitions) two things are different now:
• The present change is much faster than anything in the past;
• There are so many of us now that we have very little room for adaptation. The kinds of migrations that got people through the ice-ages aren’t possible now; nor are there new territories to exploit.

The first study.
If the hemisphere is cold enough, and seasonal conditions are right, snow that falls on land at high latitudes stays on the ground all through summer, and so accumulates from year to year. In Antarctica, this has been the state of affairs on the elevated parts of the continent for 34 million years, and on most of it for the last 14 million. In the northern hemisphere, since there is no land at the highest latitudes, ice sheets have tended to grow and then melt on most of the northern lands where there was enough snowfall to build them for the last 3 million years. 20,000 years ago, at the coldest extremity of the last ice-age, enormous ice sheets lay on North America and northern Europe, but all that is left of this now is the one on the island of Greenland. Probably some of Greenland’s ice survived the previous interglacial, but no ice older than that (125,000 years) has been recovered by drilling. What we do know is that there was a warm interval during that interglacial which was about a degree warmer than now, and that the sea rose at least 5 metres (some people think it may have been up to 9m) higher than now. That implies that a good fraction of the Greenland ice sheet melted.
How does ice tell us about past climate? Using a hollow drill, cylinders of ice can be extracted from the entire thickness of an ice sheet. Needless to say, where the ice is 2 km deep, as it is in central Greenland, and over 3 km deep, as it is in Antarctica, this is very tricky work - but the really clever stuff happens after it comes to the surface.
As the snow accumulates year after year, it sinks down and is compressed by the weight of snowfall on top. After some years, it turns to ice. But there are bubbles of air trapped in the snow and eventually in the ice, and as there’s nothing that reacts with them they last virtually for ever, and thus provide little samples of the atmosphere as it was at the time the snow fell. Both ice and air can be analysed with very clever radio-chemical techniques that tell us about the composition of the air, and many climate properties.
In this way, it’s been possible to show just how polar air temperature and atmospheric CO2 concentration have been related for the past 820,000 years - that’s the age of the deepest ice from near the base of the East Antarctic ice sheet. The story is pretty clear. Periodic changes in the northern hemisphere summer temperature caused by cyclic variations in the shape of Earth’s orbit, and the tilt of its axis, trigger a warming or cooling trend and then after a century or two (sometimes longer) the atmospheric content of CO2 begins to change in a way that reinforces the original trend - a positive feedback.
By the time other feedbacks have started, the greenhouse gases have become the driver of global climate change until a new equilibrium state is reached. This ice-core account of natural climate change is very clear for the past three-quarters of a million years. Before that, with no access to the air itself, investigators had to figure out indirect methods for estimating CO2, and none of them was very precise. One is counting the number of pores (stomata) on fossil leaves - the more CO2 in the air, the fewer stomata. Another involves computer simulations of the carbon cycle based on estimated distributions of organisms. A third method uses very precise measurements of isotopes in marine sediments. Although the chemical analyses are exact, the procedure for inferring atmospheric CO2 from them is not. That’s the problem this new study tried to solve.
Underlying the work is a very important idea: if we can know with confidence how CO2
behaved in the distant past, since we already know past temperatures reasonably well, we should be able to predict much better just what may happen to our climate in the years ahead when the CO2 is going to be a lot higher. Earlier estimates (especially for two crucial epochs: the late Pliocene, when the northern ice sheets first formed, and the mid-Miocene, when the continental Antarctic ice sheet became permanent) have been beset by uncertainties; but now it looks as if we can say with a high degree of confidence what the greenhouse gases were doing then.
The reason this knowledge is so important is this: the world has been cooling since the Eocene optimum, 50 million years ago - but not steadily. Instead there have been several distinct cooling episodes which radically changed the ice regime on Earth. It appears that the growth of polar ice caps changes the way Earth responds to climate forcings (the climate sensitivity) - in other words, the system of climate feedbacks is partly determined by the presence and extent of high latitude ice. Furthermore, it is clear that if it can be shown that some past episode of ice formation was associated with a certain greenhouse gas forcing, we should expect that if we bring about the reverse of that forcing by human activity, ice will be lost. This is the best approach we can have to predicting future sea-level rise - certainly one of the most feared consequences of warming, but poorly understood because of ignorance about the growth and decay of ice sheets in the past.

This graph shows a reconstruction of global temperature for the past 65 million years. The part that concerns the present study is on the right - the last 20 million. The peak at 15 million years (mid Miocene optimum) is followed by cooling which becomes more erratic, especially in the last 3 million, the Pleistocene - the ice-age epoch. The reasons for this history of erratic cooling during the Pliocene and Pleistocene are not fully known, but they certainly involve the dynamics of ice sheets and the interactions of the ice sheets with the biosphere as well as geophysical processes.
The investigators from UCLA [Tripati, et al, 2009; Science, 326, 1394-1397 - can be found here] used a new technique to refine the estimates of CO2 back to 20 million years. To do this, they examined carefully collected sea-bed sediment cores from two selected sites in the western Pacific. If you can find an area of sea-floor which has been undisturbed for a long time and which has been accumulating sediment at a steady rate, you can extract cores, and examine the layers of mud for the many clues they contain. Among them are the tiny shells of planktonic organisms that lived and died in the water long ago. These little shells can survive for an amazing length of time - sometimes hundreds of millions of years - and because they are made of calcium carbonate, you can coax information out of them about the composition, temperature, salinity and acidity of sea water when they lived, and from this infer things about the atmosphere.
Tripati and her colleagues used the ice core data to check their CO2 estimates and found that for this three-quarter million year period, they had a typical error of about 14ppm. This is a big improvement over previous studies.
Their main conclusions can be stated simply: at no time in the last 15 million years did the atmospheric CO2 exceed the level it is today. At the mid-Miocene optimum peak, it reached 425ppm - a number we will see again in about fifteen years from now. At this time, in the words of the authors, “there was little glacial ice on land or sea ice in the Arctic, and a marine-based ice mass on Antarctica [the West Antarctic ice sheet] was not viable”. As a consequence, the sea was 25-40 metres higher than it is now.
A study like this one cannot tell us how long the greenhouse gases would need to be above 400ppm to bring the world back to where it was 15 million years ago; nor does it tell us how fast the ice sheets would disintegrate - there are bits and pieces of evidence from elsewhere to give some clues about that - but it does tell us beyond reasonable doubt, that a greenhouse forcing of the magnitude now underway would have this effect, and that if we do not prevent it, sooner or later we will need to deal with sea-level rise in the order of 20 metres or more.
These figures show Tripati’s results in full. The one on the right covers 1.4million years, the first 800,000 of which are compared with ice-core data; on the left, two panels cover the Pleistocene (3.4 million years) and all the way back to the early Miocene (20 million years). Red dots at the top are data from plankton isotope assays; Green dots beneath are ice core (to 820,000 y) and modelled estimates. Fig 2 (B) at bottom left tells us about the last time CO₂ was in the range 400-450ppmv, where we are headed in the next decade or two. Grey bands show the uncertainty range.
was undertaken by scientists at the University of Alaska, Fairbanks together with the Russian Academy of Sciences. UAF is the leading Arctic research school in the USA and the source of some of the best work on permafrost in the world. The investigators were interested in a large area of sea-bed known as the East Siberian Arctic shelf - 2 million square kilometres of shallow water (mean depth 50m) - off the Siberian coast. It was known that the sea floor here and in many other places in the Arctic Ocean holds large amounts of frozen & dissolved methane, but everyone assumed before this study that the methane was trapped beneath a frozen layer of sea bed. This has turned out to be wrong. [Science, 327; 1246-50. You can read a summary from the NSF here; the study can be read here]
This submarine plain would have been dry land 10,000 years ago, at the beginning of the Holocene, when temperatures were about the same as the twentieth century mean (0.75℃ cooler than today) and it would have been vegetated with tundra plants.
The cold Arctic north of the tree-line is not a desert by any means. Tough, cold-tolerant plants grow there during the brief summer in vast numbers - mostly non-woody species: mosses, lichens, grasses & sedges, as well as small shrubs. But when they die, the cold prevents their decay, and instead of recycling the carbon they captured from the air during their growth, they bury it in a peaty layer of plant tissue that is very long-lasting - providing it remains too cold for the micro-organisms that cause decay. For this reason, the tundra is unusual, being the only plant community that is a large scale carbon sink.
The Tundra plants grow in what is sometimes called the ‘active layer’ - that is, the top layer of permafrost which thaws during summer for 60 days or so, and then re-freezes in winter. Where summers are too cold for this to happen, as in most of Antarctica, no plants can grow. The active layer is roughly a foot or two deep, and because no water can penetrate the permafrost beneath, it is usually very wet, and the Tundra consequently has a great many marshes and shallow lakes. These too accumulate large deposits of non-decayed plant matter, held in a preserved state by the cold and acid conditions. If ever the tundra peat is warmed enough to initiate decay by anaerobic organisms, methane is generated.
A recent estimate of the total quantity of organic carbon (potential methane) held in the Tundra was given as 1.5 trillion tonnes! Scientists have become concerned because it is clear that the permafrost is warming, and many Siberian lakes and bogs have already become carbon sources. A moment’s reflection tells you that this could be a powerful positive feedback: Arctic warming causes methane release from permafrost, which causes more warming, and so on. The concern is much more than theoretical - it is observable and it is happening now. So the East Siberian Shelf is really a big bit of what was Tundra, which has spent most of each glacial cycle out of water, and the interglacial submerged. Normally, the sea-floor surface is cold enough to retain the buried organic carbon, but in recent years that has changed.
The University of Alaska scientists have been going to sea each year since 2003, measuring the dissolved methane in water, free methane in the air at both low and high altitude, and discovering the sites of methane release on the sea floor. What they’ve found is very disturbing. The sea floor is not keeping a lid on the vast methane deposits in this shelf - numerous methane plumes from established venting sites have been found. Arctic average atmospheric methane concentrations are 1.85ppm (a bit higher than the global mean) - but they are higher than this over most of the shelf. In the water, saturation levels of dissolved methane were 250 times greater than normal in summer & 1400 times in winter. The gas is bubbling straight through the water column into the air.
Natalia Shakhova, one of the investigators, said, “The release to the atmosphere of only 1% of the methane assumed to be stored in shallow hydrate deposits might alter the atmospheric burden of methane up to 3 to 4 times. The climatic consequences of this are hard to predict.” Her uncertainty is due our imperfect understanding of the strength of this positive feedback, but some work which extrapolates from this and other escalating feedbacks, suggests that if they get started it might be impossible to stop the atmospheric CO2 reaching over 800ppm, and Arctic warming more than 10℃ - maybe twice as much.

is a report of what the GRACE satellites have been finding about the rate of melting of the Greenland and West Antarctic ice sheets over the last few years. These remarkable pair of satellites carry instruments that can measure changes in the gravity field as they fly overhead so precisely that they can be used to report on the depletion of shallow aquifers. The world’s remaining big ice sheets gain mass in winter from snowfall, but lose it in summer. The important question has been: are they losing more than they gain; and if so, is the loss accelerating over time, or steady?
The ice sheets have been the focus of a lot of recent work to try to get answers to these questions & various tools have been applied to them - but the gravity satellites are really the best thing we have, as long as certain problems of interpretation can be confidently solved. These involve a number of factors other than ice loss that can affect the gravity field over an ice sheet - for example, rising land surface; changes in the flow of glaciers or the hydrology of bedrock. The satellites have been flying since 2000, and many of these interpretive issues have now been worked out.
The study [Velicogna, GEOPHYSICAL RESEARCH LETTERS, VOL. 36, L19503, doi:10.1029/2009GL040222, 2009. You can read it here] shows trends in the GRACE data from April 2002 to February 2009. The results are given in the two graphs below. The one on the left shows the trend in Greenland, which went from net mass loss of 137Gt/yr (2002-3) to 286Gt/yr (2007-9). In other words, the rate has doubled in just 6 years. In Antarctica, the second graph, the situation is more complex. Most melting is happening in the West Antarctic ice sheet, with acceleration of glacial flow, and melting of the exposed ice sheet from the warming Southern Ocean; while the higher altitude, colder East Antarctic ice sheet (by far the larger) has been apparently in mass balance (although that may be changing).
The author estimates that mass loss in Antarctica as a whole has increased from 104Gt/yr (2002-6) to 246 Gt/yr (2006-9). If this is accepted, the increase is more alarming still. [A Gt, or gigatonne is a billion tonnes, or one cubic kilometre of water]
Look at the green curved lines on both graphs. These aren’t just drawn there. They are statistically derived functions which turn out to be the best fit to the data. What they show is that the melting rate is on an accelerating path. It’s not a very long trend, and things may turn out to be different after all - but if this finding is taken at face value, it means that physical processes are underway on both ice sheets that must end in their collapse. Evidence from past warming episodes tells us that this can happen in irregular steps, and might be much faster than seems possible now.
Remember Aradhna Tripati’s sober reflection that we appear to have begun a transition to a world as warm as the middle Miocene or worse? This is just what the transition would look like. At the end of a process of destruction of the two vulnerable ice sheets is a sea-level rise measured in tens of metres. Why are the polar regions heating up so much? This is one of the predictable effects of an exaggerated greenhouse effect - transfer of extra heat from the tropics to the poles. It was foreseen long ago and now it’s happening. In this connection, it might be worth mentioning another study just finished - an expedition to the Arctic sea-ice to find out how thick it is. Strangely, this is something satellites can’t do, because there’s not enough difference between the density of ice & sea-water.
Mostly, what you hear about is the reduction in the area of Arctic ice at the end of September, when summer melting ends - but these researchers knew that, because the ice is melting from below, it must be getting thinner. They spent weeks drilling holes by hand & found that indeed, the ice is remarkably thin - average depth over the whole sampled area was 1.77m. Normally, 40% of the polar ice cap is made of ice more than 2 years old, and thicker than seasonal ice, but now this fraction is about a quarter of what it was. Professor Peter Wadham who participated, believes we will see a virtually ice-free Arctic summer within a decade.
“It’s like the Arctic is covered with an egg-shell and the egg shell has been thinning to the point where it is now just cracking completely.”
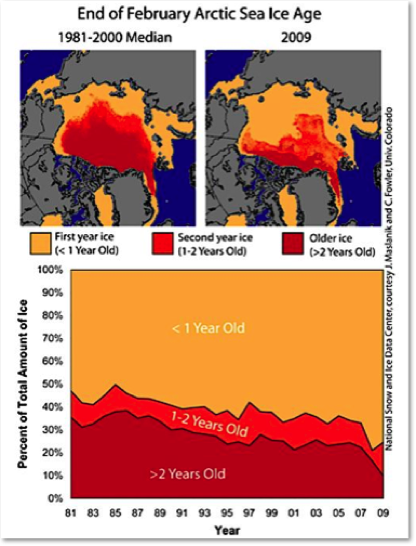
These are the findings, showing the relation of one-year seasonal ice to older, thicker ice over the Arctic Ocean. The researchers were astonished to find that most of the thin ice was in a structurally feeble condition, full of cavities and melting.
Until very recently hardly anyone who studied ice thought this was possible; now it’s inevitable.
You might perhaps think that clear evidence of severe polar warming would have the effect of motivating a new kind of public policy - something more likely to give our grandkids a decent world to live in. But no. Instead, businessmen and politicians are hurrying to the Arctic to look for more oil and gas, the very things that gave us this problem.
You might be forgiven for thinking about Easter Island when you learn this. Indeed, the metaphor is apt. But a fate like that unfortunate and tragic island is not necessary or inevitable for the people of the planet. We have what the Easter Islanders never had, which might have saved them - good understanding of our predicament, and all the means to enact a remedy. There are more than enough good people to make sure our institutions do not steer us into a grim and desperate future despite our knowledge, and the love we bear for the children who come after

The second study
The third study

