The Tripati study
Ice cores give precise assays of atmospheric CO2 as far back in the past as we have ice - 820,000 years. Beyond that, things are trickier. No really good proxy for CO2 has been found. It is possible to count the stomata (the little holes on the surface of leaves) of fossil plants, and infer something about how much CO2 was in the air. Plants tend to have fewer stomata when CO2 is abundant, because they don't need as many. The method has limits though, and isn't very accurate.
There are also radio-chemical methods that make use of the relation between sea water acidity and chemical composition. It was one of these that was modified for the Tripati study. Specifically, the scientists measured boron, calcium, magnesium and oxygen isotopes in foraminifera from two ocean cores drilled in the western Pacific.
One of the features of the study was the use of the ice core record as a yardstick of accuracy. For that period - 820,000 years - agreement was close, giving the investigators confidence that their estimates for the rest of the study period - 20 million years - would yield better precision than previous ones. It is still the best estimate we have, although it is fair to say we haven't heard the last word on this yet.

A couple of history lessons ...
important questions answered by paleoclimatology
As the Keeling curve climbs steadily toward 400 ppm, with a couple of years to go, it's a bit strange you don't often hear this ...
It's a heck of a question.
We know that once it gets there, it's going to be a very long time before it comes down on its own.
We know the warming due to it will come over a few centuries and last for many more.
And we know that 400 isn't the end - only determined actions of ours can stop it rising much higher - maybe 500 before mid-century.
So you'd think we'd be pretty interested.
Well, students of climate history have found some answers.
400 ppmv
The graph below is the work of the EPICA team, showing exactly how CO2 has behaved in the last 820,000 years - oscillating between its glacial and interglacial values of 180 & 290 ppmv.
The other one is the work of Tripati and her colleagues, who showed in 2009 that last time on Earth CO2 was sustained in the range 400-425 ppmv was 15 million years ago in the middle Miocene.
Q
Looking again at Zachos' graph, this study tells us the difference between the two red arrows - pre-industrial 18th century and mid-Miocene climates was just 100-125 ppmv of CO2 ... the same as the difference between the beginning and end of an ice-age. Remarkable.
When was the last time on Earth CO2 was 400, and what was it like then?
*
In this study, Tripati's team showed:
• Last time CO2 was 400-425 ppm was the middle Miocene (red star)
• Global mean temperature then was about 3℃ warmer than now
• Sea level was 25-40m higher than now
• There were no Greenland or West Antarctic ice sheets.
The Zachos record tells us that global temperature at 15 million years was about the same as it was at 34 million - the transition between the ice-free (water world) state and the glaciation of Antarctica.
It doesn't tell us that CO2 was the same though. The relation between these two things (the climate sensitivity) is complicated. It can be changed by many planetary conditions, including the disposition of continents, the shape of ocean basins & channels, major currents, vulcanism, presence of ice, and more.
The study on the right, a review of Cenozoic CO2, suggests that CO2 at 30 million years was around 450-500 ppm; and at least 600 ppm at the transition (although the precision of these estimates leaves a lot to be desired).
This should not be too reassuring. "Businessas usual" - where we fail to make a timely switch from fossil fuels - will get us to 600 ppmv well before the end of the century.
In any case, even melting a fraction of the Antarctic ice sheet would produce sea-level rise of tens of metres - quite unacceptable for our descendants.
400
300
180
Here's another question we should be pretty interested in:
Holocene sea-level has been pretty stable, but the seas are rising now.
Yes, we do. It wasn't very long ago ... the last interglacial before the present one, usually called the Eemian (about 131-114,000 years ago - boundaries are a bit arbitrary, as you can tell from the chart).
Being geologically recent, the Eemian is a good subject for study. Evidence of sea-level during the period can be found in old elevated coral reefs & wave-notched terraces in several parts of the world, specially the Red Sea, the Bahamas, and Western Australia - tectonically stable regions with abundant coastal features left by Eemian seas. And atmospheric CO2 is known with high precision.
The level of the global ocean depends on the volume of ice on land. That, in turn depends on temperatures; and that varies with greenhouse gases. In a recent study designed to see just how CO2 and sea-level varied over 40 million years, it was discovered that CO2 is indeed the major influence, although other geophysical properties that affect heat storage and transport have an effect too.
Do we have good sea-level records for any period when it was a degree or two warmer?
Q
Relation between CO2 & sea-level for 550,000 years. The Eemian is at the red star. A mathematical representation of the relation is on the right. This is significant because CO2 is tightly constrained by the ice core assays.
Eemian sea level
On the right is a detailed picture of sea-level change during the Eemian, made by analysing foraminifera from the Red Sea. It has been independently confirmed by another study using different methods done in Western Australia. On the sea-level scale, zero is the present - so the peak, near 122,000 years ago is about 9m higher.
The purple line at the top shows rate of change. There were two episodes here with the sea rising 2m per century or more.
For each of the three episodes (123,000; 122,000, & 120,000 years) in which the sea rose above its present level, the source of meltwater must have been the same ice sheets that are vulnerable today - the West Antarctic and Greenland.
There is debate about their relative contributions, and about other features of the Eemian record ... but these studies tell us plainly that there is some instability that can cause significant rapid sea-level rise at less than 2℃ warmer than today.
We need to remember that CO2 in the Eemian was close to 300 ppmv, and that these warm intervals were due to variations in seasonal sunlight, not greenhouse gases, and so, in that respect, the Eemian is an imperfect analogy for the present climate forcing.
On the other hand, what it tells us about the capacity of the two ice sheets to undergo partial ablation in a matter of centuries is highly relevant.
CO2 and sea-level for the middle Miocene, showing a sea-level peak near 40m for CO2 400 ppmv.
The time scale on the bottom is in millions of years. The sea-level scale on the right is in metres relative to present.
*
*
*
*
*
*
*
*
*
*
*
*
*
The world's two vulnerable ice sheets ...
Greenland, and the West Antarctic. As far as we can tell now, both would melt with sustained global mean temperature more than 2℃ higher than present - some specialists think it would take less. Between them, they have enough ice to raise the sea about 11m. Melting would take centuries (probably), but once begun, it would be unstoppable, and our descendants could only watch as coastal assets everywhere drowned and shores receded.
By our best estimates, human activities have released about 577Gt of carbon into the atmosphere since the start of the industrial era - about ⅔ of it from fossil fuel burning.
The answer turns out to be yes. If you look carefully at Jim Zachos's graph, you can see it at 55.5 million years ago. It's the spike marked with a red arrow. Paleoclimatologists know it as the Paleocene-Eocene Thermal Maximum (PETM), when there was a sudden warming of about 6℃.
A lot about the PETM is not well understood - for example, there were some severe effects on life in the sea, but few are detectable on land. The episode seems to have occurred over a couple of thousand years - but it might have been multiple events, each of which were much faster. Global temperatures appear to have taken about 170,000 years to return to where they were.
Q
Has this ever happened on Earth before ... a lot of carbon getting into the atmosphere fast? If so, what were the consequences?
The PETM
Evidence for something unusual was first discovered in 1991, when researchers found a well-marked discontinuity in the abundance of 13C in foraminifera in deep sea cores from all over the world. The event corresponded to the temperature spike disclosed by an excursion of the 18O/16O ratio. A lot of subsequent work has made it clear that the two findings must be related ... in other words, there was a sudden warming at 55.5 million years, and it was caused by an equally sudden release of carbon from some organic source into the atmosphere, raising greenhouse gas concentrations.
Once this became clear, the search was on for a cause. It would have taken a very large injection of atmospheric carbon to bring on 5 or 6℃ of warming - but where did it come from? What might have destabilised it? And what were the consequences? Here are some of the answers, as far as we know them. A lot still remains to be learned about the PETM.
1. It seems clear that at least 2-3,000 Gt of carbon entered the air during the event - an amount that compares roughly with the quantity of recoverable fossil fuel reserves we could burn this century. With this thought in mind, it is possible to conceive a human-induced PETM. Some scholars think the amount of PETM carbon must have been higher - a lot depends on what we think the climate "sensitivity" to greenhouse forcing was at the time - something we can't really know - for now.
2. It looks as if a lot of the carbon was released in the first few thousand years - maybe a lot quicker. Some evidence suggests it took place in at least two discrete episodes, each containing rapid phases. It probably lasted about 170,000 years - that is, before the global carbon cycle returned to where it was.
3. One of the earliest suggestions for a source was the large deposits of methane "ice", known to geologists & oceanographers as clathrates, buried under the sea bed in high latitudes, especially the Arctic. A big clathrate melt would fit the evidence very well. Physical disruption or melting would saturate the water with methane. It would then bubble up to the air and eventually oxidise to CO2. The deposits could have been disturbed by tectonic events associated with the opening of the North Atlantic ocean ... there was a major volcanic episode near Greenland at just this time. However, some researchers don't think there was enough frozen methane at the time to produce the observed effects.
4. There was a marked acidification of the ocean, as you'd expect, but the effects on marine life have been hard to unravel, apart from a significant extinction of foraminifera. Responses on land are even less clear.
5. It appears the PETM was not unique. A couple of other sudden, smaller "hyperthermal events" have been detected in the record, suggesting that, whatever the cause, it was repeatable. On the face of it, this should strengthen the clathrate hypothesis, because these deposits are accumulating all the time (they are just frozen un-decayed organic debris) and anything at all that can destabilise them could trigger such an event. It should also make us think about the size and permanence of these deposits today.
The Eocene was already much warmer than it is now, so the behaviour of the Arctic submarine clathrates today wouldn't necessarily be the same. On the other hand, the deposits are likely to be a lot bigger, since there has been no clathrate "event" for some tens of millions of years, and the ocean is colder. Nobody knows how much is lurking there, nor how vulnerable it might be to a warming Arctic ocean. But we do know methane in the Arctic is on the move (see below).
The East Siberian Arctic Shelf
In March 2010, a team of Russian & American scientists reported on what they had found during six years of field work in the Arctic. The report raised plenty of eyebrows, and its significance is still being debated.
The scientists had been measuring methane in the water and air at many places in this large area of shallow Arctic sea. During ice ages, what is now sea floor is tundra, so it accumulates lots of peaty stuff - the source of methane. It had been believed that this carbon was sealed underneath a frozen layer of mud - but the results showed otherwise.
Average methane concentration in the Arctic turned out to be 1850 parts per billion by volume (ppbv). The global mean is 1400 ppbv. 150 years ago it was 700 ppbv. Plumes of methane escaping from the sea floor were observed in large numbers. Methane is soluble in water, so a lot of this doesn't enter the air directly; on the other hand, methane is a potent greenhouse gas - about 25 times as powerful as CO2 over a century, and about 70 times as potent over 20 years.
These scientists expressed great concern about the potential for future massive methane releases ... in their own words:
They found that more than 80 percent of the deep water and more than 50 percent of surface water had methane levels more than eight times that of normal seawater. In some areas, the saturation levels reached more than 250 times that of background levels in the summer and 1,400 times higher in the winter. They found corresponding results in the air directly above the ocean surface. Methane levels were elevated overall and the seascape was dotted with more than 100 hotspots.
Study area in the shallow sea off the Siberian coast.
Below (R) is a map of the methane venting to the atmosphere, reported in 2010
Other scientists are trying to assess the quantity of methane released from thawing tundra. Below is a newly formed tundra melt lake, emitting methane in summer.
If we are foolish enough to allow CO2 to climb to 500 ppm or higher, we could be certain the great land-based ice sheets - Greenland & Antarctica - would produce a lot of meltwater ... but we don't know exactly how they would respond.
As it happens, an answer has been found in records hardly more ancient than our history of agriculture - the trajectory of sea-level rise from the end of the last ice-age to the beginning of the Holocene. The data is plentiful. It can be found on continental shelves all over the world. The story is quite straightforward - the sea started rising 19,000 years ago with the onset of warming, and levelled off about 8,000 years ago, 120 metres higher - a mean rate of rise of 1.1m per century, sustained for almost 10,000 years. In between, the rate of rise varied spectacularly, with a notable episode called meltwater pulse 1A, in which the sea rose 20 metres in about 500 years. This is a sustained rate 12 times the present rate ... 4m a century ... 40 mm every year!
Q
How fast could the sea actually rise, if these huge masses of ice "collapsed"?
Meltwater pulse 1A
On the right, you can see the pattern of sea-level rise from glacial maximum to stable Holocene, reconstructed from a bunch of studies named in the list & marked with different colours. The current trend of 3.4mm/yr is shown for comparison.
Most of the meltwater, of course came from the two very big northern ice sheets that aren't here any more - but not all.
On the left is a study of old submerged reefs in Tahiti, published in 2012. It was designed to shed light on a vexed question - where, exactly did the water for pulse 1A come from?
You might think that after all this time, there would be no way to know - and that is strictly true. On the other hand, the scientists found some interesting clues.
When a big ice sheet melts, a lot of mass - trillions of tonnes - shifts from one place to be spread all over the ocean. That has discernable effects on Earth's gravity field and the axial rotation. The land, relieved of its enormous load, rises up, displacing sea water. The result is a predictable pattern of sea-level rise at places near and far from the ice sheet.
In this case, if the MWP1A meltwater came mostly from the Laurentide (the ice sheet over North America) the ultimate sea-level in Barbados would have been 40% less than Tahiti. In fact, the two places show about the same amount, which is consistent with a source in Antarctica, rather than the north.
For now, we don't know which sector of that great ice sheet might have been responsible; nor do we know if this could happen again. But if this study is correct, we do know that it can "collapse" and generate something like 6,000,000 km3 of water in 500 years.
That's probably all we need to know to be wary of warming it up too much.
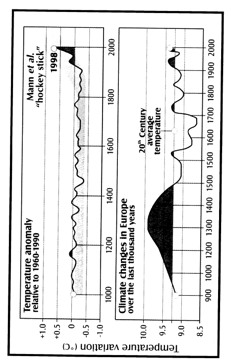
Some people have said that 20th century warming is nothing new or special. The "medieval warm period" (about 950-1250AD), when the Norse colonised Greenland and vineyards flourished in Kent, they say, was warmer than it is now, and everything was fine. We have nothing to worry about.
This claim is made frequently by people who deny that there is a climate problem, or that it has been exaggerated. Professor Ian Plimer, for example, writes: The late 20th century warming was somewhat cooler than the Medieval and Roman warmings [Heaven & Earth, p63]. He believes warm times are great for human societies, so we should welcome what has begun, not fear it.
The trouble with this view is that there is no evidence for it whatsoever. Plimer, lacking any decent backing for his claim, used spurious data which does not show what he says it does. Nobody with opinions like these has produced anything better.
Q
Is it true that modern warming is nothing special; that it was warmer in the middle ages?
Figure 11, from Heaven & Earth, Prof Ian Plimer's book, which he uses to prove it was warmer in the middle ages. Trouble is, the graph shows no such thing. It is a sketch of a diagram from a work by Hubert Lamb in 1965 concerning the climate history of central England. It has nothing to do with global temperature; it was compiled from old weather records, not modern proxies - and both graphs have been distorted in favour of Plimer's point ... that the "hockey stick" reconstruction of global temperature over a thousand years or so is false.
But it isn't false. Since Michael Mann first published it, his findings have been independently confirmed over and over by different investigators using different methods . He published a major update himself in 2008, using improved techniques.
The medieval warming was not "suppressed" as Plimer and others claim; it is represented in proxy studies exactly as it occurred.
The Holocene temperature record
This is the reconstruction of global mean temperature over the last 11,300 years, published in 2013 after masses of scrupulous work on the data and synthesis. The blue line represents the mean of included studies; the light blue band is the range of uncertainty out to 5% probability (1σ). The proxy data runs out around 1940, so the red bit is the record of meteorological thermometers up to the present.
You can see the medieval warming - that little spikes with a red arrow.
Much more striking is the long cooling trend since the "Holocene optimum", at around 5,000 BC - 0.7℃ in total - entirely reversed in 100 years by anthropogenic warming.
Shaun Marcott and his colleagues, who did this study, carefully combined 73 separate sources, mostly sea floor samples, to get the reconstruction. No specialists have the slightest problem with its results, which, in any case, are consistent with what was known already. This is the best quality picture of Holocene climate we have so far.
The original "hockey stick" from 1998 (as well as all subsequent studies of the last 2,000 years) used a combination of tree-rings, cave deposits, corals and lake bed cores - because these are the most accurate proxies for that period. You can see how the error band in the Marcott study gets wider in this interval. Nevertheless, the results in the two cases agree very closely. This is not contrivance - it tells us the paleoclimatology methods are sound.
On the right, you can see Michael Mann's original graph (the blue line) with another one from 2007 using improved techniques (the red line), and the instrumental record in black. All careful attempts to show the temperature record of Earth in the historical era converge on this result.
It might have occurred to you that, if we had not warmed things up, the world would still be cooling. As far as we can tell, this is true ... though whether we would have slid into an ice-age sooner or later is still debated.
The thing these studies show plainly is that humans have accidentally become the controllers of Earth's climate.
If you want to know more about the "HOCKEY STICK CONTROVERSY" there's a decent article at RealClimate, here
*


A careful study of the carbon dioxide history of Earth published in 2023 confirms this finding.