Goodbye, the Arctic
Our planet has been naturally cooling for 50 million years. Almost as soon as it began to do so, the first winter sea ice appeared in the Arctic. A permanent, year-round polar cap formed about 14 million years ago, at the same time as the great Antarctic ice sheet reached its modern size. The Arctic we know is about 3 million years old.
Now something astonishing is happening: the ice on the top of the world is heading for extinction.
A few days ago we learned the sea-ice floating on the Arctic Ocean had begun to grow again, bringing to an end a record summer melt season. The 3.4 million square kilometres left on September 16th 2012 was by far the smallest area ever observed.
Very precise data on the trend in summer ice minimum over the last 30 years, together with measurements of the changing ice thickness and sea-surface and air temperatures in the Arctic give us every reason to believe that there will be a summer sometime in the next 20 years - maybe much sooner - when the ice will all be gone in August and September, and you’ll be able to sail right to the North Pole.
What does this change in a very remote region of the planet mean?
IT MEANS A LOT. The best way to see that is by asking a couple of other questions.
30/09/2012
What’s happening in the Arctic?
Each year, as the Arctic sun gets lower in the northern sky, the ocean surface gets colder and begins to freeze. The ice area grows fast during October, then more slowly until March; then, as the sun rises again, the sea-ice begins melting at the edges and underneath, slowly at first, then, after June, more rapidly until mid-September when it starts to re-grow again.
Along the way, many different things affect how much ice floats on the ocean surface - currents in the sea; storms and winds that break up the ice and push it through Fram Strait into the North Atlantic (and to a smaller extent, through the Chukchi Sea into the Pacific); the temperature of the near-surface air during summer and spring; the quantity of snowfall - and others.
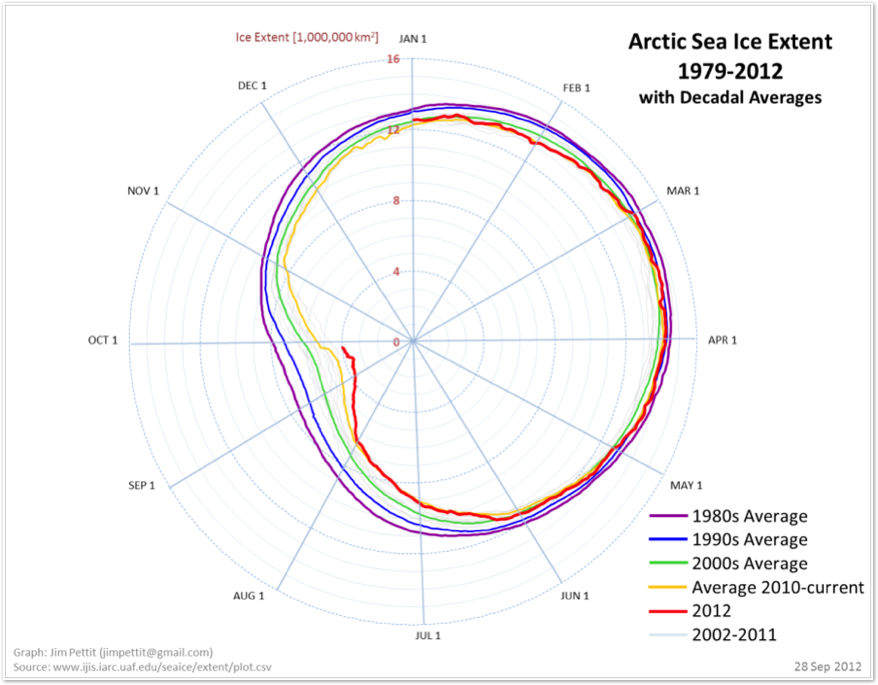
Look carefully at Jim Pettit’s graph below and you can see this cycle: the historical maximum ice extent (purple line) in March at around 14.5 million square kilometres, and the Fall minimum around 7.5 million. Now look at the red line for this year. Obviously the mid-winter ice extent hasn’t changed much, but at the other end of the year it’s fast approaching zero. [The purple, blue and green lines represent the three decades of satellite instrument observations]
What could be making the ice so vulnerable to ablation in summer?
Two main things:
• Steadily rising summer temperatures in the Arctic (the rate of Arctic warming is two or three times faster than the global mean);
• And steady loss of ice thickness - as more and more of the winter ice is only one season thick (about 3 feet or less) it gets mushy and breaks up more easily in summer.
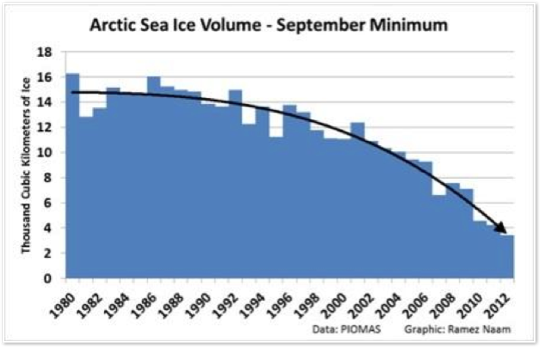
Look at the trend in the VOLUME of Arctic ice at left and you can see why experts are concerned that this line will hit zero sooner rather than later. All it would take is a warm summer with a combination of winds and currents to flush broken ice out of the Arctic Ocean basin.
This point about ice thickness is very significant:
During the 30 years we have accurate measurements, most of the thick, hard, multi-year ice has gone, and the total VOLUME of sea-ice at end of summer/spring is only about 20% what it was in 1980
What are the climate effects of a smaller Arctic ice cap?
There are several powerful ones:
1. The polar ice cap is like a giant mirror, reflecting sunlight off the top of the world; and a giant refrigerator, storing “cold” in high latitudes - a sort of heat sink.
So what happens if we muffle both these geophysical functions? Well, solar radiation that once bounced off the white ice and snow is then absorbed into the dark Arctic ocean water. The exact quantity of heat acquired this way isn’t easy to calculate, but because the sun shines day and night in the Arctic summer, it is very large - by some estimates, about as large as all the warming due to human activity. In other words, loss of the ice could double the effect of anthropogenic warming.
Warm Arctic ocean water doesn’t stay still ... added heat is transferred to the atmosphere and to water further south.
2. Loss of the polar mirror is a self-reinforcing process: greenhouse warming of the Arctic atmosphere turns white ice into dark water; the exposed ocean absorbs more summer warmth; ocean warming causes more ice to melt. This is called the “ice-albedo feedback”, one of the big reasons Arctic warming is going so fast.
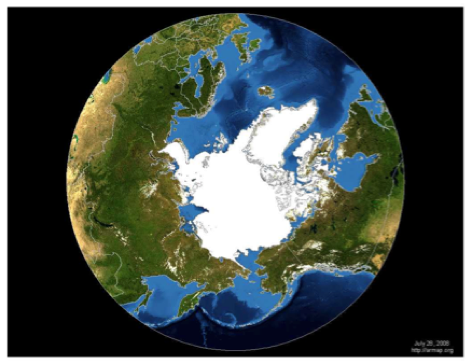
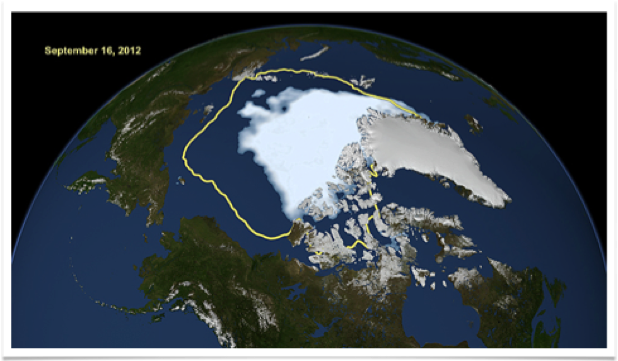
Looking at these two maps, you can see how much of the great polar mirror has been darkened. The top one is a satellite composite showing the sea-ice in summer 1999. The lower one shows this year’s minimum, with the outline of the average extent (not the historical extent still observable in 1980 - that would have been larger still) for the last 30 years in yellow.
The extra area available for absorbing summer sunlight is about equivalent to twice the island of Greenland, or ⅔ of the continent of Australia.
This new heat reserve puts more water vapour into the Arctic air, and thus increases winter snowfall; and it warms the sub-polar tundra lands, adding to the thawing of permafrost in Siberia, Canada and Alaska.
3. The polar jet-stream is weakened. At both poles, temperature difference between the poles and mid-latitudes creates high-level fast air currents flowing west to east which frequently dominate the weather of a lot of the northern hemisphere. (The southern polar jet-stream affects only Antarctica and so hardly any people are bothered by it) It is now clear that as the Arctic warms, the jet-stream flows slower, meanders further north and south, and is more often stalled in what meteorologists call a “blocking pattern” with a meander stationary for weeks or months. This condition is associated with extreme weather events like heat-waves, droughts and flooding rains.
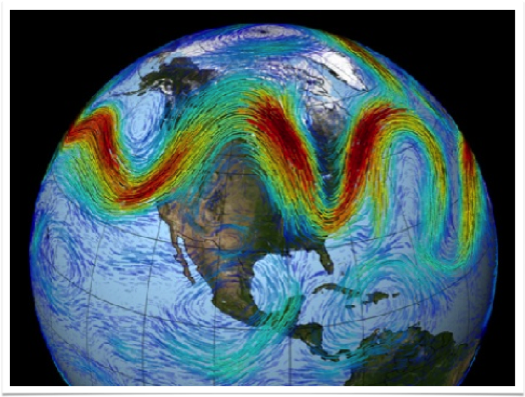
Exactly this pattern is held responsible for some of the most severe weather catastrophes of recent years in the northern hemisphere: the 2003 European heat wave; the one in Russia in 2010; the Texan drought of 2011. (Tropical monsoonal events such as the Pakistani and Thai floods have quite different causes)
Recent analyses have concluded that the likelihood of severe blocking events will be much higher in future as the Arctic continues to warm up.
4. Arctic methane. A vast area (about 11.5 million square kilometres) of northern lands beyond the tree line is tundra - an environment where only cold-adapted shrubs, grasses, sedges, mosses and lichens grow. It’s the only terrestrial region on Earth which is a net carbon sink - because normal decay of plants is inhibited by the cold - so the permafrost soils of the tundra are full of un-decayed plant matter - by some estimates about one-and-a-half times as much carbon as the total contribution of humans to the atmosphere over 200 years. Plant tissue under these conditions is not oxidized to CO2, but processed anaerobically to yield methane.

As well as the tundra lands, big areas of the Arctic Ocean floor, specially off the Siberian coast, are shallow shelves which, in glacial times when sea-level is lower, are also tundra. These too have very big deposits of buried vegetable carbon and frozen methane. The total quantity under the Arctic Ocean shelves has been estimated at maybe five times as much as in the permafrost.
Now, if permafrost thaws, its sequestered carbon gets into the atmosphere, either as methane gas, or CO2. In fact, this is happening already, both in the tundra and the ocean shelves. Both are of course, potent greenhouse gases. What concerns the people who study this is just how much permafrost carbon could eventually enter the atmosphere and how fast. Right now, it looks as if the contribution will be modest but long-lasting ... but the quantities are so huge and the science is so incomplete there’s plenty of room for the possibility of a catastrophic release of methane somewhere in the future as the Arctic continues its rapid warm-up. We are in the position of staring straight into the crater of a volcano, with no idea if and when it will erupt. The thing is, studies of Earth’s climate history show this has happened before.
Is this geophysical change unique?
Can the world get by with a small and shrinking north polar ice cap?
The ice may be gone for a couple of months in autumn, but it will be back in winter. This has happened before. It’s not a big deal.
This objection has some merit. Summer sea-ice probably has been greatly reduced earlier in the Holocene, about 8,000 years ago. No methane catastrophe followed; the ice came back.
Well, to know what recent changes mean, we have to consider two issues: how weird is the recent ice loss ... is it really like prior natural losses? And how much further has it got to go?

To get an idea of the speed of the sea-ice change, look at the graphs above. The one on the left shows winter ice (green) and summer (red) since 1880. Clearly, the summer minimum began declining around 1900, accelerating sharply about 50 years ago; while winter ice only started to shrink about 1960.
The graph next to it shows the loss of the last 30 years in detail, indicating how irregular it is from year to year, and how it seems to have taken a dive in the last decade.
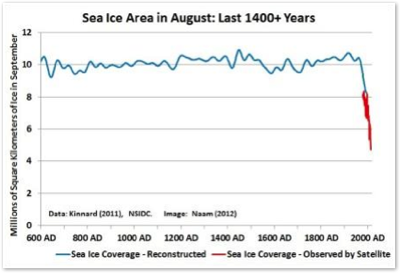
The graph on the right puts this in a longer context, with reconstructed data back 1450 years. Seen this way, the modern ice loss looks very sudden and drastic, and nothing like the pattern of natural variability over that period.
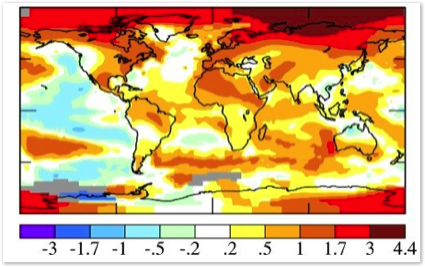
Now look at the global map showing the mean annual surface temperature anomaly for 2011. What you see is the aggregate DIFFERENCE between the recorded temperatures at thousands of weather stations all over the world that year, and a base-line mean temperature for the period 1951-1980 - a standard often used in these analyses. The scale at the bottom is in degrees C. Redder is hotter.
It’s easy to see the Arctic is leading the global warming trend, with parts of the Arctic ocean gaining 4℃, and the entire region more than 1.7℃. This is very fast warming indeed.
Both graphs are from an excellent review paper by Ramez Naam, available at Scientific American blogs:
http://blogs.scientificamerican.com/guest-blog/2012/09/21/arctic-sea-ice-what-why-and-what-next/
Map from GISS: http://data.giss.nasa.gov/gistemp/2011/
The great Arctic thaw is really a message from the people of the future.
It’s hard to think of one that could speak louder or more plainly of what we must do. Now.

• We know it has only taken 40 years to destabilize the Arctic ice cap - the seasonally variable sea-ice and the great ice sheet on the island of Greenland;
• We know the principal cause - an augmented atmospheric greenhouse effect - is accelerating each year with our continued additions of CO2 and other gases;
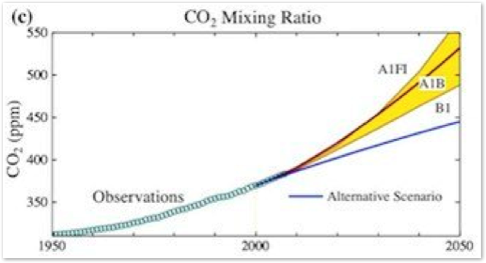
• We know that, unless we make up our minds to abandon fossil fuel burning and adopt better forestry practices, CO2 concentration in the air will exceed 400 ppmv by 2016, and reach 450 ppmv somewhere around 2030. The yellow segment in this graph shows the likely range of CO2 until mid-century ... about 475-575 ppmv;
So now we confront two awkward facts:
• No known natural processes could cause the very rapid Arctic warming ... it's unique
• Arctic warming isn't finished - it's only just begun. Another 3-4℃ will almost certainly be added in the next 40 years, and no one knows when or where it will end.
• We know that 450 ppmv is quite enough to eventually melt all northern hemisphere ice, and in the long run, raise sea-level about 25-30m;
• We know that a cascade of climate effects would follow this drastic re-arrangement of the global climate system - a few of them favourable, like new agricultural lands in Canada & Russia, but most very damaging;
• We know a number of feedbacks in the Earth's system of energy balance that would potentially accelerate warming were they to be triggered;
• We know the conditions we create over the next few decades will leave consequences lasting, not years or centuries, but tens of thousands of years.
WE ARE GEOLOGICAL AGENTS NOW, responsible not just for the welfare of our descendants here on Earth, but the conditions of life for all other species too.
If you have trouble with the astonishing idea that humans can affect the planetary surface on the same scale as geological processes, you are not alone. But it is certainly true. Many such impacts have been rather carefully measured ... distribution of vegetation types on land; cycling of elemental nutrients like nitrogen and phosphorus; mineral transport from land to ocean by erosive processes; the abundance of species and the stability of ecosystems. But the one that interests us here is our colossal impact on the composition of the atmosphere.
In less than 200 years we have added 1.1 trillion tonnes of CO2 to the air, raising the concentration of this gas by 120 ppmv. Under typical natural conditions this change would have taken several million years. Our annual contribution of more than 40 billion tonnes of CO2 equivalent is between 100 and 150 times as much as all the world’s volcanoes in a typical year ... and we do it year after year with no plans to stop until all the oil, coal and gas is gone.

