
400 ppm ... what does it mean?
4/06/2012
Last month, observatories all over the Arctic - in Norway, Greenland, Alaska, Iceland and even Mongolia, began reporting something new - daily average CO2 concentrations over 400 ppm by volume.
A kind of Milestone
Each year in the Arctic, the atmospheric CO2 rises to a peak in May, then declines to a minimum in September before rising again. The effect is due to respiration in the vast Boreal forests. During the long Arctic winter, the dormant conifers and tundra plants release metabolic CO2; then during the vigorous growing season, May to September, they take it from the air to form new plant tissues.
You can see by comparing the records from Barrow, Alaska (at 71° N) and Mauna Loa, Hawaii (at 19° N) that the annual oscillation is much larger near the pole. Typical difference between May and September in the Arctic is 10-15 ppm; in the tropics, 5-6 ppm.

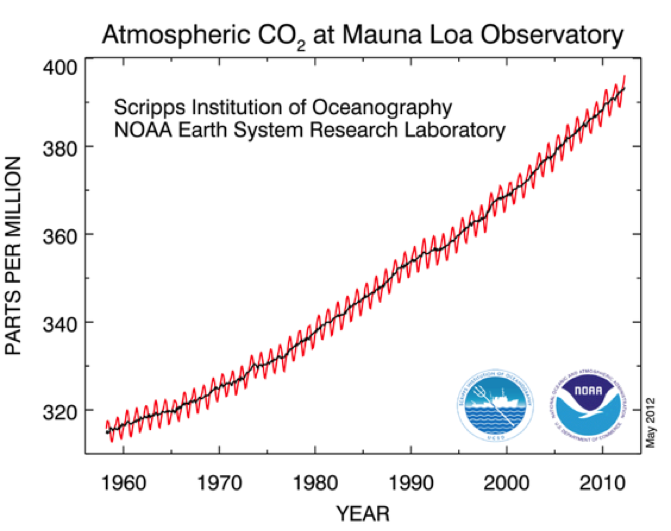
But because CO2 is well-mixed in the global atmosphere, over the course of a year, the average concentration everywhere converges. That’s why the sloping line tracking the annual mean in both graphs is basically the same.
Over the next few months, Arctic CO2 will retreat from this peak down to about 385 ppmv before turning round. And it will be about three more years before the global annual mean reaches the 400 ppmv milestone on its way up to some eventually much higher maximum. We have no idea what this will be.
Does 400 ppm matter?
It depends. Insofar as this is just a step in a steady rising trend, it isn’t specially significant; but if you are impressed by round numbers (and who is not?) it certainly is. Why? Because of the answer to the implied question: When was the last time on Earth you could have measured 400 ppm?
The answer to this could hardly be more important if we want to understand the new climate state that will evolve during the tenure on Earth of our descendants.
It will take a while for the planet’s energy balance to adjust to a stronger greenhouse effect - so even if the CO2 rise were to stop right where it is, all the surface warming due to that would take several decades to arrive. Other consequences like continental ice-sheet melting and sea-level rise would take longer still, evolving over some centuries.
The physical relation between greenhouse gases and the energy budget is such that these consequences are utterly predictable at the end - so if our knowledge were perfect, we would be able to say with confidence at what height the sea would stop rising once the system is again in equilibrium; and even say exactly how fast it would happen. But alas, we can’t do this because we don’t know enough detail about these things to make useful predictions. In these circumstances, investigators use another approach: applied climate history.

Seeing the future with lessons from the past
Here’s how it works. If you can specify, for some past era in the Earth’s history
• what the greenhouse gases were doing;
• the global mean temperature;
• the amount of ice on land,
you can safely predict that the relation between these variables will be the same should any of them recur. This is because of the way they are causally linked, and because climate change under natural forcings is slow (typically hundreds or thousands of times slower than the current human-induced change) and so Earth’s energy balance is nearly always close to equilibrium. So any set of observations from a past climate state tells us what we can expect in the future once the anthropogenic forcing has run its course.
Here’s what we know very clearly from study of
climate history:
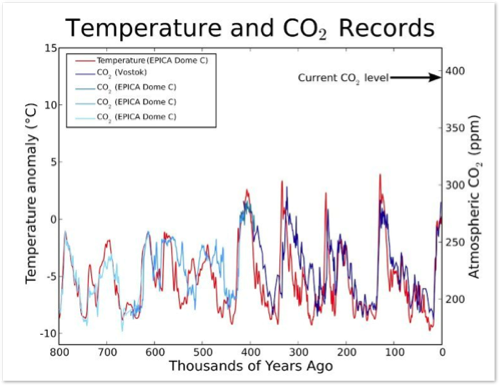
• During Pleistocene ice ages (the last couple of
million years) CO2 varied between 180-190 ppm at
glacial maxima, and 280-300 ppm at interglacials.
• We know this because we have access to old ice
in Antarctica, just over 800,000 years old - a period
covering eight full glacial cycles - and the ice holds
samples of air that yield precise assays of atmos-
pheric composition, and these are consistent from
one cycle to the next.
• The ice record shows a very exact relation between
the greenhouse gases and global mean temperature.
You can see it in this record from two deep Antarctic
ice cores.
• Detailed study of oxygen isotopes in the ice can tell us about local air temperature at the time the ice formed, and the total volume of the Earth’s water bound up in ice-sheets and glaciers, which is related to sea-level.
• Sea-level can be studied from other evidence as well: old shore-profiles, ancient reefs, and debris.
• The deep-sea temperature can be inferred from study of fossil shells in selected sea-floor sediments extracted in cores.
• From these sources, we know that the global mean temperature during the last million years has never been more than about 1℃ warmer than now; sea-level was 6-9 metres higher during two warm interglacials (125,000 years and 400,000 years ago) and 120 metres lower during the last cold glacial maximum.
• Before the time of the oldest ice (820,000 years) we have good temperature records, and some good data on sea-level, but not very good evidence of atmospheric composition. CO2 for the Pliocene and Miocene must be inferred from indirect evidence of ocean chemistry, or from details of fossil plants. This is not really satisfactory, but the most recent studies give cause for some confidence in their estimates. This is what they tell us about our question:
• The last time CO2 was in the range 400-425 ppm was about 15 million years ago. Global mean temperature was about 3℃ warmer, and the sea 25 - 40 metres higher. There was no Northern hemisphere ice, and no West Antarctic ice-sheet.
Ocean thermal inertia
If the CO2 has arrived at 400 ppm (actually the global mean is
now 392 ... it will get to 400 in either 2015 or 2016), then why
don’t we see these conditions now? In fact, it will take most of
this century for the surface temperature (near-surface land &
surface ocean) to reach equilibrium, and probably a few centuries, or maybe longer, for the great ice sheets to respond to the addition of our century of warming. Just why is this so?
This is the conclusion of a study by Tripati et al, published in Science in 2009. It appears to be the best such study to date, although further work is needed to increase confidence in the methods developed by this team.
Other studies on the same problem are cited at the end of the report, so you can get an idea what has been done.
You can use this link to read the study
The answer is interesting - and pretty inconvenient for our grandchildren, and theirs, and theirs ...
Most heat on Earth’s surface isn’t held in the air, which is where we notice the temperature, but in the ocean. Water takes up heat slower than air, but holds much more of it (about 3,500 times as much). If we pump up the atmospheric greenhouse effect, extra heat is immediately trapped in the lower troposphere - that’s the first result. Second, the heat is fairly quickly shared with the surface layer of the ocean, because of the stirring effect of waves and wind. Most greenhouse warming escapes our notice because it goes under the ocean waves within days, although locally, it is exchanged between air and ocean all the time - that’s why regions of warm ocean water cause those characteristic displays of atmospheric energy, storms and hurricanes, and why cold water causes fogs.
But the third step is the one that really counts in the long run. At a few places in the global ocean, warm surface water sinks into the deep, joining the system of slow currents that transfer the majority of Earth’s surface heat around the globe. It isn’t lost. Eventually the heat re-surfaces a century or so later. This is the ponderous system that accumulates greenhouse warming and then, in time, delivers it to the various components of the surface - including the ice-sheets of Greenland and Antarctica.
400 ppmv isn’t the end
Look at the CO2 observations again. These graphs are on the
way somewhere ... but where?
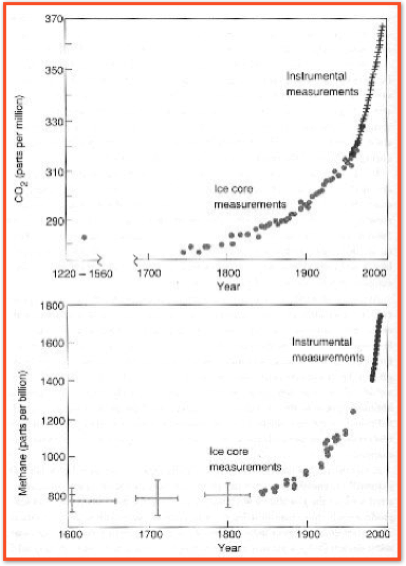
You can see the rate of rise accelerating since about AD 1800.
That’s the era of human industry fuelled by fossil energy. You
can see how the line gets steeper around 1900 when the oil age
began. When Charles Keeling began recording at Mauna Loa in
1958, the average annual rise was 0.7 ppmv. For the first
decade of the 21st century it was just under 2 ppmv.
Last year (2011) it was 2.3 ppmv, the biggest increment yet
measured.
On these trends, we can expect it to pass 400 in 2015, and 425
about a decade later. So by 2025 we will be past the range
specified in the Tripati study. By mid-century (on the same trend)
the score would be getting close to 500; and by 2100, probably
in the range 800-1,000 ppmv. It’s important to understand that
although these are approximate numbers, they are not going to
be far off - but in any case, their implications are so vast that an
error of 20 or 30% would not really matter. How so?
Think about what 25 metres of sea-level rise means. Almost every coastal town, city and village on Earth would be devastated.
Ruddiman, 2005. Plows, Plagues and Petroleum. Princeton University Press. p 156
There is enough ice in the world - 90% of it lying on the Antarctic continent - that melting it would raise the sea 70 metres. How much CO2 would it take to do that? Do we know? Well, yes and no. We don’t know exactly how warm it would need to be to melt the great East Antarctic ice-sheet; nor do we know how long it would take. But we know that there was no ice sheet there 35 million years ago; we know the Earth was warmer by about 3-5℃, and the sea was indeed 75m higher than it is now. CO2 was probably not much more than 500 ppmv.
So you can see that even with indicative numbers, we can be sure that this state of affairs is well within reach. The 400 ppm milestone should ring alarm bells so loud we could not possibly miss their warning. We should listen for the voices of the people of the future imploring us not to leave to them a drowned and impoverished world.


Manhattan would pretty well disappear; so would most other large cities founded on estuaries and harbours. Unless Tripati is wrong, the sea will rise year after year, century after century until all the melting due to 3℃ warming is done. We would be rushing around trying to save this and that, but all our efforts would be eventually overwhelmed and we’d have to do it all again. Think of the cost. Think of the hundreds of millions of people needing new homes. Think of the lost agricultural land on deltas and coastal plains.
And then recall that this is what will happen IF WE STOP NOW. But we won’t.