
Four signs of trouble
but just the same, if we are to understand it properly, we need to see that it is really a symptom of something else - the extraordinary, rapid expansion of human presence and activity in the last couple of hundred years ... specially the last 50.
This is a planetary phenomenon unlike anything that ever happened on Earth before (as far as we can tell) and it has a number of important consequences beside the climate ones.
On this page, we'll take a look at a couple of things that might help you place the climate problem in its background. That should make it a bit easier to see it the way experts do.
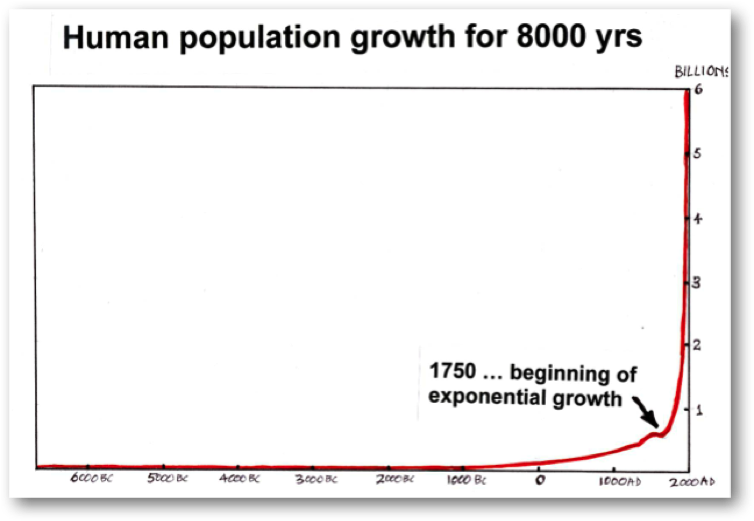
This red line shows the extraordinary explosion of human population during the last 150 years. There was nothing inevitable about this - it was caused by our discovering better ways to adapt to life in large communities, and underpinned by the exploitation of fossil fuel energy (first coal, then oil and gas).

Within a few months of starting work on Hawaii, he had shown that the whole Earth does the same, as the great northern forests respond to the seasonal cycle – something no one had ever seen before. Then, in 1960, after just three years of data, he announced something much more significant. After each seasonal oscillation, the mean concentration had risen by about 0.7 ppm. This annual trend has continued ever since – except that now the increment is 2 ppm and rising. So what Keeling has done is to give us a precise measure of how much of the 38 billion tonnes of CO2 humans produce each year is retained in the atmosphere (about 57%); and from this we can calculate how much warming to expect.
You can think of this set of data, painstakingly recorded by sampling the air on a lonely mountain-side every four hours for over 50 years (and now in several other places too), as the key piece of evidence that there is a climate problem. Once you know this is happening, and you understand what changing CO2 does in the climate system, you can figure out a lot about the consequences. For example, geophysical theory and study of climate history can tell you the relation between CO2, temperature and sea-level.
We know now that the concentration had already been rising when Keeling started, but by chance he was there at the beginning of the truly spectacular surge of the late twentieth century. The more we learn about Earth's climate history, the more clear it is that injecting several hundred billion tonnes of fossil carbon into the atmosphere in 100 years is a singular event in the planet's long story. As far as we can tell, no natural process could do this - only human ingenuity. Now we are staring at the milestone of 425 ppmv, knowing with great certainty that no atmosphere for millions of years has held that much greenhouse gas; knowing with equal certainty what we must do to turn it around - but too timid or complacent to do it.
Exhibit 2 is the result of the work of Charles Keeling. It shows the record of atmospheric CO2 measurements made continuously since February 1958 at an observatory on Mt Mauna Loa, Hawaii.
Keeling became interested in measuring CO2 as a graduate student in the early 1950s at a time when nobody knew for sure whether the concentration of this trace gas in the air was constant from place to place, or time to time. He developed techniques accurate enough to settle these questions and in doing so, demonstrated that the CO2 in the air of a growing forest declines during the day, when the leaves are photosynthesising, and rises again at night when they transpire. In other words, he showed the forest breathing.
This short video might help you appreciate this rather incredible thing ... how it is possible for a single species to profoundly alter the whole atmosphere so much that Earth will be warmer for many thousands of years.
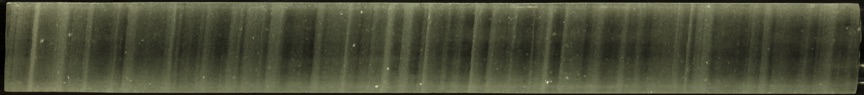
Section of Greenland ice core, showing annual layers due to the large snowfall and marked seasonal contrast.
The section is a metre long, from a depth of 1,637m. The ice is 16,250 years old and represents an interval of 38 years.
GISP2 temperature proxy, showing reconstructed Central Greenland temperatures for 80,000 years. The numbers refer to rapid warming events known as Dansgaard-Oeschger (D-O) events. 23 of them are known to have occurred during the whole of the last ice-age. They have an underlying frequency, but the exact cause is unknown. #1 marks the abrupt termination of the glaciation, followed by the episode of cooling known as the Younger Dryas, followed in turn by the Holocene interglacial. Notice that this, relatively stable era that has been so kind to us humans, hasn't been exactly a smooth ride.
Taking the record back 5 million years to the beginning of the Pliocene era reveals another scale of climate instability. The top graph is the complete record of 5.2 million years; the bottom one is 800,000 years in greater detail. The longer one is made from study of sea-floor sediments; the other more detailed one from ice cores. Both show the same kind of semi-regular behaviour. Clearly, on long time scales, the climate system oscillates between two quasi-stable states - but look closely and you can see that this rhythm itself changes over time, as the planet has cooled. Both the magnitude of these reverses and their frequency must be somehow sensitive to Earth's geophysical conditions. As you might expect, this is a very active field of study. The bottom graph is the detailed record of the last eight "ice-ages". It was made from studies of the deepest Antarctic ice core so far, the EPICA core, drilled at Dome C between 1996 and 2005. The ice at the bottom (3,190m down) is 820,000 years old.
An interview with James Hansen
Hansen has been called the grandfather of global warming - not without reason.
Until his retirement in 2013, he had been director of the Goddard Institute in New York, a division of NASA, and one of the world's leading climate research centres, for more than 30 years. He admits to being a naturally reticent guy, but says he decided to advocate publicly for climate action once his grandkids arrived.
He wrote one of the best books for general readers who want to understand the climate problem, and he continues in retirement, to devote lots of time to advocacy because, he says, future people need us.

Exhibit 1: The growth of human population on planet Earth for the last 8,000 years. If you want to know what it would look like for the whole of human existence, imagine it extended way to the left for about 30 times this long. The red line would be on the bottom all the way. Now look at the left edge. This is about the time we were domesticating goats and cattle. There were maybe 10 million people on Earth. After that, we learned how to live in bigger & bigger settlements and feed lots of sedentary people, so by the peak of the Roman Empire in the 4th century AD, there were 200million people. Then, about 150 years ago something happened, setting off an explosive population growth that has not ended & may result in 9.5-10 billions by 2050. I hope this graph looks as extraordinary to you as it really is. Just reflect: it took 1,300 years between the Emperor Constantine and the time of Shakespeare for the world to acquire its second 200 million; the last 200 million arrived in just 3. Nothing like this can happen to a population in balance with its environment – exponential growth always means somebody is losing – either competing species, or the people of the future whose resources have been consumed.
It’s no mystery what made the explosion possible – it was the discovery and widespread exploitation of fossil fuel energy. Without this, the world would be agrarian, not industrial, and it would look very much the way it did in the middle ages – a bit more crowded perhaps, but much more like the world of Shakespeare than like our own. Of course, numbers are not everything, and if it could be shown that we are ‘paying our way’, then perhaps 9 or 10 billion of us might continue to inhabit the Earth indefinitely in some sort of comfort and stability. But the opposite is the case.
All of the energy captured for the use of living things on Earth – all of it – is sunlight trapped by green leaves and other photosynthesising organisms. The amount of it so captured in one year is known as the planet’s primary productivity. Every bit of energy used by all other creatures is subtracted from this. It has been calculated that humans consume about 40% of the total – all the rest of the biosphere has to get by on what is left. In addition to this current account, every year we also exploit the energy of about 400 years worth of ancient plant growth in the form of long-buried carbon in fossil fuels. [This study can be read here] This is a direct debt incurred to our descendants which we have no hope of repaying. In other words, we are gobbling up our birthright, and mining the future.
Ever since Thomas Malthus published his essay at the beginning of the industrial revolution, the population problem has been politically fraught. I am in no position to pronounce upon it – actually, the real problem is not population itself, but resource consumption and its consequences. I have discussed it here as a diagnostician, not a therapist (like everyone with descendants, I have my share of responsibility) to point out that it is both cause and consequence of the climate threat, and that in a crowded world we have very little room to adapt to a disrupted climate system. But if Malthus got his predictions wrong (which he certainly did) he was perfectly correct in principle, as modern studies in ecological history have shown. Any population that earns its growth as an unsustainable debt condemns its own descendants to penury.
Other things cause the temperature trend to wobble around too. This is another GISS record, this time showing the 5-year running mean on top of the annual one, as well as the major volcanic eruptions and the Pacific Decadal Oscillation (El Nino/La Nina cycle). Big volcanoes can inject large amounts of aerosol - smoke, dust, ash, sulphate haze - during eruptions. The record confirms what theory predicts - that each episode of volcanic aerosol cooling typically lasts a couple of years before these substances are removed by rain and wind and chemical reactions.
The semi-regular events of the Pacific ocean cycle have the effect of changing the way heat is distributed between atmosphere and ocean. Since the Pacific is Earth's biggest ocean, this has global consequences. Close study of the last decade has revealed why the rate of atmospheric warming has been lower - more heat has been entering the deep ocean. For the time being, therefore, it is isolated from the air. If this turns out to be correct, we can expect warming to resume at the former rate when the current La Nina phase of the cycle ends. We shall see.
Exhibit 3 Surface warming, as recorded by meteorological stations over the last century or so.
Several research centres specialise in the work of generating a record of "global" temperature from thousands of local observations all over the world. They have to be careful that the data is reliable, that their statistical methods are sound, and that they can account without bias for the parts of the surface without many observations - the oceans, the poles, the deserts, etc. The fact that their estimates agree very closely, even though they use somewhat different techniques - plus rigorous technical review, justifies high confidence in their results. The records here are made by the Goddard Institute in New York (GISS), one of the three principal monitoring laboratories. You can visit their website to find all their current and past data, here:
The top pair of graphs shows the record for the whole period in which there has been sufficient data to compose a global mean. Three different resolutions are shown. The blue graph shows how much variation there is between successive years; the red one shows the effect of plotting 5-year means year after year; the black one does the same for 11-year means. You can see the same trend in all three, but the blue annual one invites the inference that there has been no warming since the year 2000. From that data alone, such an inference can be neither affirmed nor denied. You can only say something about the trend if you allow the natural variability of the climate system a decade or more to work itself out.
In the lower pair, ocean surface temperatures (and Antarctica) have been excluded. You can see that warming has proceeded quite differently in the northern hemisphere, where most of the land is, and that winters have warmed more than summers - except for the last few winters. Both these features are predictable from greenhouse theory - they should not occur if warming had another cause.
All the records show a definite pause in the century-long warming from 1940 to 1975, also more pronounced in the northern hemisphere. Despite much searching, no natural reason for this has been found. It is almost certain to have been due to the large quantities of opaque aerosol pollution pouring from factories and power plants in the industrialised north during the long post-war economic boom. All the rich nations implemented air pollution controls in the 1970's, after which warming resumed. Opaque aerosols (smog, etc) reflect sunlight, acting like a sunshade, and so cause cooling. In the quantities involved they are very powerful at this, and if emissions are reduced they are quite quickly removed from the air - so although no studies of aerosol effects on radiation balance were done at the time, this explanation appears sound.
The implications of this occurred to scientists almost as soon as the discovery was made. Hans Oeschger, the Swiss investigator who did as much as anyone to demonstrate the reality of abrupt climate change spent much of his late career trying to convince colleagues and officials that raising the CO2 is just such a forcing with very real potential to trigger an unpredictable "climate surprise". Wally Broecker, a founding student of climate history tells his students the climate system is like a big angry beast, safer if unprovoked. Understanding just what comprises an equilibrium state, and what induces abrupt climate change is now one of the great challenges of climate science, because, as things stand, these processes aren't captured by current climate models, and so can't be forecast with much certainty.
But wether we understand it or not, the reality of abrupt climate change has emerged as perhaps the key insight of paleoclimatology (the study of ancient climates). It tells us that we can't expect to predict all the results of messing with the climate system, but neither can we expect reassurance. This should provide all the grounds we need to be concerned about our grandkids' future.
The one thing certain about the climate future is that it will bring surprises. In a crowded world, utterly dependent on fossil fuel energy, we've been tipping the waste from those very fuels into the air until their accumulated effects have become obvious. If there had been a carbon sewage system to keep CO2 out of the air, we wouldn't have this problem; as it is, we must find such a system pretty soon, or stop burning carbon. If we want to make the problem manageable, it's a simple as that. Otherwise our grandkids will have to do what they can with the mess, under conditions much less favourable than those we have enjoyed.
From these records came the very first intimations that Earth's climate was not the slow-changing, ponderous thing that geologists (who were the first to study it) had always imagined. Instead, here was clear evidence of a system in unstable equilibrium, capable of tipping rapidly from one state to another and back again under some small perturbation.
The ice evidence has since been confirmed from other sources, so there can no longer be any doubt that this is a basic, if unexpected, property of the Earth's climate system ... a typical response of the system to a "forcing" is not sustained and predictable evolution of its present state, but abrupt switch to another one.
Exhibit 4 Evidence of ABRUPT CLIMATE CHANGE
This graph shows something extraordinary. It is a record of near-surface air temperature in central Greenland, extracted from the GISP2 long ice core drilled in Greenland and completed in 1992. It emphatically confirms what previous cores had suggested ...
that when climate changes, it can do so suddenly.
The amazing detail is what makes this record so remarkable. It was created by very careful study of a number of cores recovered from the Greenland ice cap between 1966, when scientists first figured out how to do this difficult work, and 1992 when they eventually drilled all the way to bedrock, two miles beneath the frigid surface in the centre of the island.
Greenland ice is almost all that's left of the great sheets of thick ice that covered much of North America and northern Europe until 16,000 years ago. It has remained because summer temperatures there have never been warm enough to melt the previous winter's snow. As each season's snow is compacted beneath the one following, it is gradually turned into solid ice; air trapped in the snow forms bubbles, which, at a certain depth become permanently embedded. They are then atmospheric archives, and can be analysed to find the exact composition of the air at the time they were isolated.
Due to the pattern of snowfall in Greenland, it is remarkably easy to distinguish the annual layers, just like tree-rings, and a great deal can be inferred about conditions when the snow fell, including the temperature.
GET THE FULL-SIZE VIDEO AT YOUTUBE
The climate problem is serious


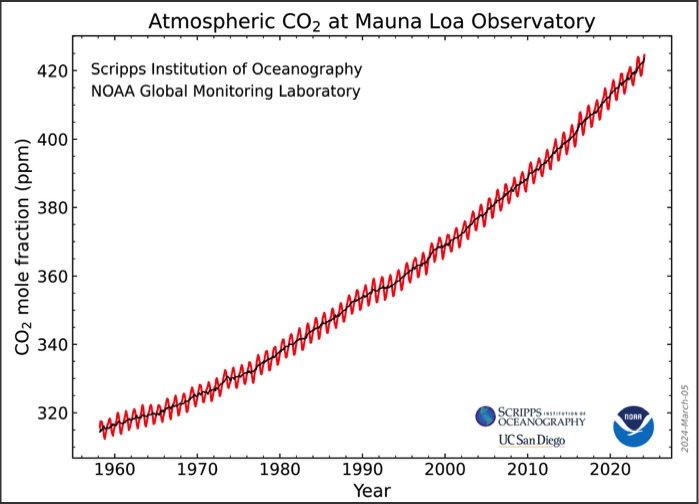
The top graph shows the complete Mauna Loa record, with its annual oscillation, and it's invariant rising trend. Nothing shows so clearly the lack of resolve in our societies as this. Before the climate problem can be resolved, that rising jagged line must turn around and descend.
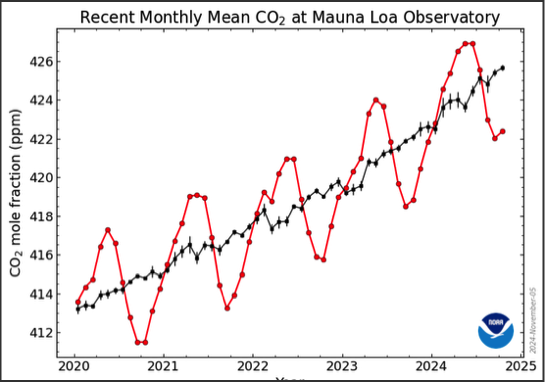
The bottom graph shows five years in detail. Each red dot is a monthly mean, with a peak in May and minimum in September.