

How did people get to be weather-makers?
It seems incredible - the idea that one species of animal could alter the planet's atmosphere enough to change the whole climate.
Not just a little bit either, but profoundly, and fast.
Yet it is true. Of that there's not the smallest doubt.
And yet, perhaps because it's implausible, many people do doubt it. If you discuss this with others you will find all shades of opinion from acquiescence to vehement denial. Here's where we take a look at the evidence that this strange proposition is indeed true:
Human activities of various kinds have become the dominant influence on Earth's climate.
What I've provided here is a sketch of the evidence demonstrating that we are causing the warming of the world, and nothing else.
There is a mountain of other evidence, and no credible alternative.
If you want to investigate this further, the best place to begin is Skeptical Science. Use this link.


Coal and oil for a year
Coal mountain 1,400m high
15 kilometres round the base
Oil tank 1.7 kilometres on a side
The first thing to say is:
We burn a lot of carbon.
It wasn't always so. For all of human history, until less than 200 years ago, nearly all the energy we used was our own muscle, with a modest contribution from animals. Fuels like wood and dung & fat were just a small fraction.
Then came the age of industry, and that began to change.
Looking at the chart showing the growth of energy use, you can see how, even then, it took a while to get going. The real energy boom only started after 1950.
The quantities are prodigious.
Nothing like this has happened on Earth before. Millions of years of accumulated fossil organic minerals are combusted in the blink of an eye, transferring all the carbon straight to the atmosphere.
Even by the middle 19th century, we burnt much more wood than coal. The age of oil didn't start until well into the 20th century.
The enormous growth of energy use since then is partly due to the spread of the industrial economy to billions of people; and partly due to our ingenuity inventing lots of ways to harness fossil energy. Above all, it was because the fuels were so abundant and cheap (until very recently).
The enormous growth of human population is both a result and a cause of the energy bonanza.
A short video to help you appreciate just how recent and extraordinary our energy bonanza is.
It is both cause and consequence of the rise in our numbers and prosperity. Energy and wealth form a "virtuous feedback" with each other. They have always promoted civilization this way, but never on a scale even remotely like now.
For many folks, this question lingers in the mind even when the facts seem to be all there. It just doesn't appear possible that even large amounts of gases could mess up the whole planet. It's just too big ... and we're so small. For some folks I guess the idea looks arrogant, as if we were taking a role that belongs to God.
There are a couple of ways you can know for certain.
1. BOOK-KEEPING
The diagram above, from the 2013 IPCC Report, is a summary of the quantities of carbon stored and moving around the Earth's surface systems. The stuff added by human activity is in red. Don't worry about the details - but these quantities are pretty well known. All countries keep records of how much fuel they consume. Ecologists and others can figure out the transfers between reservoirs with a reasonable degree of certainty. We know how much of the carbon entering the air should remain there & so we can compare that with the record of atmospheric concentration. They match very closely.
2. OXYGEN DEPLETION
It stands to reason that if we burn a lot of combustible stuff, we should be using up oxygen. All the oxygen is made by plants - there's no other source - so if they go on making the same amount, we should be able to measure the loss of oxygen. It's not easy because there's a lot of oxygen in the air, but very careful measurements first done a couple of decades ago confirmed that we are indeed using up oxygen at just the rate you would expect. If the CO2 came from anywhere else but burning in the atmosphere, that wouldn't happen.
The falling trend is clear in this graph recorded at Mauna Loa ever since Ralph Keeling figures out how to do the measurements. Oxygen on top; CO2 underneath.
3. THE 13C SUESS EFFECT
Carbon on Earth exists as two stable isotopes, as well as one radio-active one (14C). 12C, the common one, is about 99% of all carbon atoms. 13C is close to 1%, while 14C is much rarer. When plants incorporate carbon from the air during photosynthesis, the chemical reaction slightly favours the lighter isotope, so, depending on the type of plant, the ratio of the two common isotopes in plant tissues is skewed ... plants typically contain about 2% less 13C than the air.
As a result, there are two kinds of test you can do to tell if CO2 came from burning plants, rather than, say, volcanoes.
First, since we've been burning large amounts of ancient plants, and CO2 has been accumulating in the air, we should be able to measure a downward trend in the abundance of 13C in the atmosphere. All we need is some record of the isotope composition of the air over a couple of hundred years. As an example, a study done in 2010 using coral, which builds a durable carbonate mineral from dissolved CO2 showed exactly this. The results matched theoretical predictions very closely.
Second, because 14C is unstable and decays in a few tens of thousands of years, there is none left in fossil carbon. So because all the CO2 from fossil fuel burning contains no 14C, its addition to the atmosphere will have the effect of reducing the overall abundance of that isotope in the air. This effect has been measured too.
So the numbers add up when we count everything; and the chemistry adds up, but what if you used the best computer models to simulate the climate over the last century, and include all the things that might have changed it, including solar cycles, sun-spots, volcanoes, El Nino. What happens then?
4. SIMULATIONS
In this experiment (from the IPCC 2007) the computer model was supplied with all the "forcings" known to have operated on the climate system since 1900. It was asked to simulate a temperature record for that century. Various versions of the data were used for several runs (the yellow mess of lines in the top graph). The wobbly red line is the mean of these results.
Then the human-caused forcings were taken out, leaving the natural ones and the experiment was re-run (mess of blue lines in the lower graph). The blue line is the mean for this.
Then the actual temperature record was placed on top (jagged black line).
Many people feel a bit suspicious of climate models, but even if you feel this way, I can assure you, this is not a put-up job. This kind of "attribution" experiment has been done so many times in many different ways that we can say with great confidence that:
A robust model can reproduce the last century's climate record if and only if it includes anthropogenic forcings - not otherwise.

Energy and wealth.
In the world we humans have built, energy is power and wealth. It always has been. That's why Empires always used slaves.
Today, we are unimaginably rich (compared to our ancestors), and we have more slaves than ever. Where are they?
According to World Bank data, each and every citizen of the world (on average) uses energy equivalent to 14 barrels of oil each year. A barrel of oil contains the energy equivalent of 3,000 man-days of labour (about 1,500 kWh).
So every human on Earth has at their disposal the labour of 115 men.
We don't see a lot of this of course - it's embedded in the food and goods we consume, the services we buy and the personal labour we save by using machines. Neither is it equally spread. People in rich countries have a lot more than their share. And it's not without consequences. Slaves must eat and breath even if they are fossils ... that's where all the CO2 comes from.
So to fix our problem we must either find some cleaner slaves or give them up. If this was easy I guess we'd have done it before, but it's rather nice being pampered, so we're dragging our feet instead.
Just think, each time you fill your car with 40 litres of refined gasoline, you've recruited the energy equivalent of 700 men to carry you around in comfort. In this respect, we are like the greatest emperors.
Enter Text
=
X 700
How do we know for sure that humans are the cause of the climate problem?

Could most of the warming be caused by something else?
You could grant, as some people do, that human economic activity is adding CO2 to the air, and still wonder if the observed warming is due to it. Some people doubt that adding CO2 causes warming - but that is foolish and ignorant. To claim this is like saying bacteria don't cause disease. Some people wonder if the warming might have other causes. Well, there is strong evidence - apart from the models - that modern warming is all due to an enhanced greenhouse effect.
1. GEOPHYSICAL CONSEQUENCES
Over a hundred years ago one of the most brilliant scientists of his time, Svante Arrhenius, worked on this problem, and figured out that if the greenhouse effect were enhanced by extra CO2, there would be certain consequences. This was long before any of them could be observed. His thinking about this has since been confirmed by modern theorists - there are perfectly good reasons for each prediction, all to do with the way greenhouse heat is added to the bottom of the troposphere. So how right was he?
• He said that the poles would warm more than the rest of the world;
• He said the land would warm more than the sea;
• He said winters would warm more than summers;
• And he said nights would warm more than days.
Each of these biases has since been observed

GISS global map showing the temperature anomaly (difference from a base period - 1951 to 1980) for the year 2010, a warm year, representative of the last couple of decades. You can clearly see how the Arctic and northern high latitudes have the lion's share pf warming - about 2 or 3 times as much as the global mean of 0.62℃. The next warmest place is the Antarctic Peninsula. Also, the continents show more warming than the ocean, which is also typical.
Comparing the pattern of warming between night & day for Australia over the last century. You can see that annual maxima began to exceed the base period mean only in the last decade or so; but the annual minima (which corresponds to the frequency of hot nights) has been sharply above trend for 35 years.
The reason greenhouse warming affects nights most is that the greenhouse effect is the only thing that keeps nights from being abysmally cold, like they are on the Moon. Nothing but the greenhouse gases stops the day's heat radiating out through the atmosphere to space in a matter of hours each evening. So if you add more, this beneficial effect is strengthened.
A pair of GISS maps showing temperature anomaly for the last 33 years, in winter (left) and summer (right). This effect is only apparent over a couple of decades. Nothing prevents cold winters from year to year regionally, even in the presence of a long-term warming trend.
2. TROPOPAUSE HEIGHT
If the bottom of the atmosphere acquires heat, the troposphere will expand, so its upper boundary, the tropopause will rise. This effect was first identified in models, then measured over 30 years ago. It cannot occur if warming has any other cause. Warming caused by the Sun, for example, would heat and expand the stratosphere.
In this study, you can see the trend in tropopause altitude (a rise of several hundred metres over 35 years or so), and the various major volcanic eruptions that have temporarily reversed the trend. A rise of the tropopause, together with stratospheric cooling, which has also been observed, is diagnostic of greenhouse warming.

The evidence from John Harries' 2001 study comparing the records of satellite observations in 1970 & 1997. The signature is shown here - reductions in transmission at precisely the spectral frequencies predicted by theory. Nothing but the observed rise in greenhouse efficacy can account for this effect. CO2 is on the left; methane on the right; three different CFC's & ozone are in the middle. It is as clear as a diagnosis can be.
After Crosby, A, Children of the Sun, 2006. Norton. p162
3. GREENHOUSE SIGNATURE ON EARTH'S OUTGOING RADIATION
If you take a spectrometer above the atmosphere and focus it down, you can record the pattern of Earth's radiation as it escapes to space. If you compare this pattern between two periods, you could see if there's been a change. If rising greenhouse gas concentrations have been retarding Earth's radiation in the meantime you would expect to see this.
The experiment to test this was done in 2001. It produced a virtual fingerprint of greenhouse warming. The wavelengths implicated by the study are exactly those that were predicted.
4. IT'S NOT THE SUN
Solar irradiance has been measured in the satellite era since 1979. This the record.
This data comes from the Scripps Institute, where it is collected & analysed. If you are interested in this, there's a good CDIAC article about measuring oxygen depletion here
Despite many studies designed to find a contribution from the Sun, warming since the 70's shows no solar effect at all. Whether the Sun had much to do with warming in the first half of the century is still debated. But it has nothing to do with it now.
To see whether this could explain some or all of twentieth century warming, you can put this on a graph with the observed temperature. Solar output before 1979 can be approximately inferred from sunspot data. This is what you get.
GET THE FULL-SIZE VIDEO AT YOUTUBE


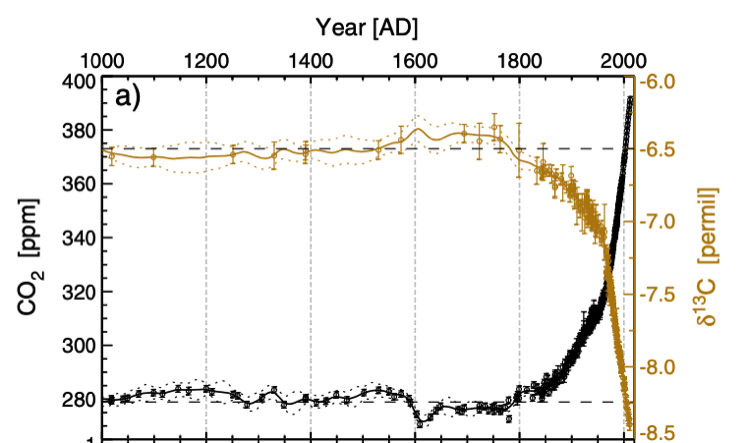
This study used ice from a core at Law Dome in Antarctica to analyse CO₂ (black line); and 13C isotope fraction in the gas for the last 1,000 years. Bubbles of air trapped in the ice provide the atmospheric samples. What you see is the accelerating rise in atmospheric CO₂ from around year 1800, and the matching fall in 13C. No other history except combustion of organic carbon over those two centuries could produce these findings.